Gold Asks Is $6000 Or $3000 Next? While Silver Decides Between $50 And $150
- GOLDALYZE

- 1 day ago
- 19 min read
Scroll Down For English Version
وقت نکال کر تفصیل سے پڑھنا ایسی باتیں روز نہیں لکھی جاتی۔ گولڈالائز کا مکمل تکنیکی اور بنیادی تجزیہ پیش کر رہا ہے کہ آیا سونا 6000$ یا 3000$ کی طرف جائے گا اور چاندی 50$ یا 150$ کا رخ کرے گی۔
کیا ہوا
سال 2026 کی پہلی سہ ماہی میں سونے نے تاریخ کی سب سے طاقتور ریلیوں میں سے ایک دیکھی۔ 4300 ڈالر کی سطح سے شروع ہونے والا یہ سفر چند ہفتوں میں 5594 ڈالر فی اونس کی تاریخی بلندی تک پہنچ گیا۔
پاکستان میں مقامی مارکیٹ نے اس اتار چڑھاؤ کو اپنے ہی انداز میں ظاہر کیا۔ کراچی میں سونے نے اس سال کے اوائل میں 585000 روپے فی تولہ کی تاریخی بلندی کو چھوا تھا۔ 13 جون 2026 کے مطابق پاکستان میں اوسط مقامی ریٹ تقریبا 440000 روپے ہے جو اس تاریخی بلندی سے تقریبا 145000 روپے یعنی تقریبا 25 فیصد کم ہے۔
چاندی نے پاکستان میں 18500 روپے فی تولہ کی بلند ترین سطح دیکھی تھی اور اسی تاریخ کے مطابق اوسط ریٹ تقریبا 7100 سے 7350 روپے کے درمیان ہے جو اس بلند ترین سطح سے تقریبا 60 فیصد کی گراوٹ ظاہر کرتا ہے۔
گولڈالائز نے 430000 روپے کی لانگ ٹرم چینل سپورٹ کو وہ سطح قرار دیا جو طے کرے گی کہ پاکستانی سونے کا دو سالہ بل ٹرینڈ ساختی طور پر برقرار ہے یا اس سے بھی بدتر کسی صورتحال کی طرف بڑھ رہا ہے۔
اس وقت کیا ہو رہا ہے
جون 2026 کے وسط تک سونا تقریبا 4000$ پر سلام کئے 4219 ڈالر فی اونس پر ٹریڈ کر رہا ہے۔ 200 روزہ موونگ ایوریج اس مکمل بل سائیکل میں پہلی بار نیچے کی جانب ٹوٹی ہے جو ایک بڑا ساختی واقعہ ہے اور گولڈالائز نے اس کی نشاندہی اس وقت ہی کر دی تھی جب یہ ہوا۔ تازہ ترین کمی کی فوری وجہ مئی کے غیر متوقع طور پر مضبوط نان فارم پے رولز رپورٹ تھی جس نے شرح سود میں کمی کی امیدوں کو شدید دھچکا دیا اور ڈالر کو مضبوط کر دیا۔
گولڈ سلور ریشو اس وقت تقریبا 65 پر ہے یعنی ایک اونس سونا خریدنے کے لیے تقریبا 65 اونس چاندی درکار ہے۔ تاریخی طور پر 60 سے 80 کے درمیان کا ریشو وہ دورانیہ سمجھا جاتا ہے جب چاندی سونے کے مقابلے میں سستی ہوتی ہے اگرچہ چاندی کے لیے کسی شدید گراوٹ کے دوران یہ ریشو کسی بھی ریورس سے پہلے اس سے بھی زیادہ بلند ہو سکتا ہے۔
کیلنڈر کا سب سے بڑا واقعہ 17 جون کا فیڈرل ریزرو اجلاس ہے جو کیون وارش کی چیئرمین کی حیثیت سے پہلی پالیسی میٹنگ ہوگی اور اس کے ساتھ نیا ڈاٹ پلاٹ اور اقتصادی پروجیکشنز کا خلاصہ بھی آئے گا۔ مارکیٹ تقریبا 97 سے 98 فیصد امکان ظاہر کر رہی ہے کہ شرح سود برقرار رہے گی۔ اصل سوال شرح سود کا فیصلہ نہیں بلکہ زبان ہے۔
اس سب کے اوپر ایران کی جاری جنگ ہے جو 28 فروری سے شروع ہوئی اور اب تین ماہ سے زیادہ کا عرصہ گزر چکا ہے جبکہ آبنائے ہرمز عملی طور پر بند ہے۔ یہی وہ اہم بنیادی موڑ ہے جو اس پورے دورانیے کی تعریف کرتا ہے۔
سونے کے 6000 ڈالر تک جانے کا کیس
تیزی کے کیس کا آغاز اس حقیقت سے ہوتا ہے کہ سونا اس اصلاح کے باوجود سال بہ سال تقریبا 30 فیصد بلند ہے یعنی طویل مدتی رجحان ٹوٹا نہیں صرف ٹیسٹ ہوا ہے۔ تاریخی بلندی سے 24 سے 25 فیصد کی کمی سیکولر بل مارکیٹس کے اندر معمول کی اصلاحوں کی حد میں آتی ہے اور سونا اس سائیکل میں دوسری بار ایسا کر رہا ہے جبکہ گولڈالائز کے اپنے چینل تجزیے کے مطابق ہفتہ وار بنیاد پر طویل مدتی چینل ابھی نہیں ٹوٹا۔
جیوپولیٹیکل فلور غیر معمولی طور پر بلند ہے۔ ایران کی جنگ حل نہیں ہوئی۔ آبنائے ہرمز عملی طور پر بند ہے اور ٹریفک جنگ سے پہلے کی سطح کے ایک حصے پر ہے، اور کسی بھی شدت میں اضافہ جیسے ایرانی توانائی تنصیبات پر حملے یا ٹینکرز پر حملے دنوں میں تیل کو دوبارہ 150 سے 200 ڈالر کی طرف بھیج سکتے ہیں۔ تاریخی طور پر ایسی صورتحال مرکزی بینکوں کو ہنگامی لیکویڈیٹی اقدامات کی طرف مجبور کرتی ہے چاہے ان کی ہیڈ لائن پالیسی شرح سخت ہی رہے اور افراط زر کے خوف کے ساتھ لیکویڈیٹی انجیکشن کا یہ امتزاج سونے کے لیے سب سے زیادہ سازگار ماحول ہوتا ہے۔
فیڈ کے معاملے میں ایک حقیقی امکان یہ ہے کہ وارش ہاکس کو مایوس کر دیں۔ انہیں خاص طور پر نامزد کیا گیا تھا کیونکہ ٹرمپ کم شرح سود چاہتے تھے اور ٹرمپ نے واضح طور پر کہا ہے کہ وہ کٹس کی توقع رکھتے ہیں۔ اگر وارش کی پہلی میٹنگ مارکیٹ کی موجودہ ہاکش پوزیشننگ کے مقابلے میں ایک ڈووش سرپرائز پیدا کرتی ہے تو شارٹ ڈالر پوزیشنز کا الٹ جانا اور ریٹ کٹ امیدوں کی دوبارہ قیمت بندی سونے کو دنوں میں تیزی سے اوپر بھیج سکتی ہے بالکل ویسے ہی جیسے فروری میں صرف ان کی نامزدگی نے ہی کئی سو ڈالر کی حرکت کو متحرک کیا تھا۔
مرکزی بینکوں کی خریداری ایک ساختی ستون ہے جو ختم نہیں ہوا۔ ڈی ڈالرائزیشن کا تھیم جس نے سونے کو تقریبا اٹھارہ مہینوں میں 2300 سے 5500 ڈالر سے زیادہ تک پہنچایا یہ صرف ایران کی جنگ کے بارے میں نہیں تھا بلکہ یہ مرکزی بینکوں خصوصا ابھرتی منڈیوں کی جانب سے زیادہ سونا اور کم ڈالر ریزرو رکھنے کی ایک کئی سالہ تبدیلی کی عکاسی کرتا ہے۔ یہ خریداری کسی چھ ہفتے کی اصلاح سے واپس نہیں ہوتی۔
آخر میں خالص تکنیکی ساخت کے لحاظ سے 4200 ڈالر کا زون جو اس وقت ٹیسٹ ہو رہا ہے یہ سالانہ اوپننگ کے ساتھ ہم آہنگ ہے اور کئی تجزیہ کاروں نے اسے اس آخری دفاعی لائن کے طور پر شناخت کیا ہے جو ایک بہت گہری حرکت سے پہلے موجود ہے۔ اگر یہ سطح برقرار رہتی ہے تو 4900 کی طرف بحالی اور بالآخر 5594 کی تاریخی بلندی کو دوبارہ ٹیسٹ کرتے ہوئے 6000 ڈالر کی طرف بڑھنے کا منظرنامہ غالب ہو سکتا ہے۔
سونے کے 3000 ڈالر تک جانے کا کیس
مندی کا کیس اس تکنیکی نقصان پر بنا ہے جو پہلے ہی ہو چکا ہے۔ سونے نے اس سائیکل میں پہلی بار 200 روزہ موونگ ایوریج کو نیچے کی طرف توڑا ہے۔ یہ نفسیاتی طور پر اہم 4500 ڈالر کے زون سے نیچے جا چکا ہے اور کئی پلیٹ فارمز اب اسے روزانہ اور ہفتہ وار ٹائم فریمز پر سٹرونگ سیل قرار دے رہے ہیں۔ کئی تکنیکی ڈیسکوں کے مطابق 4319 ڈالر سے نیچے کلوزنگ بنیاد پر بریک اگلی بڑی کمی کا دروازہ کھول سکتا ہے جس کے بعد بہت نیچے تک کوئی خاص سپورٹ موجود نہیں۔
اگر اوپر بیان کردہ تیل اور سونے کا الٹا تعلق برقرار رہتا ہے تو یہ مندی کے کیس کا انجن بن جاتا ہے۔ جب تک مارکیٹ بڑھتے تیل کو سیف ہیون اشارے کے بجائے فیڈ کے سخت رہنے کی وجہ سمجھتی رہے گی ہر جیوپولیٹیکل شدت جو ماضی میں سونے کے لیے مثبت ہوتی، اب ییلڈز اور ڈالر کے بڑھنے کی ایک اور وجہ بن جائے گی جو مکینیکل طور پر سونے پر دباؤ ڈالتی ہے۔ اگر ایران کی جنگ مہینوں تک اس ساکن حالت میں رہتی ہے جہاں تیل بلند رہے لیکن واقعی تباہ کن سطح تک نہ پہنچے تو سونا محض ریئل ییلڈز کے بلند رہنے کے ساتھ نیچے کی طرف کھسکتا رہ سکتا ہے۔
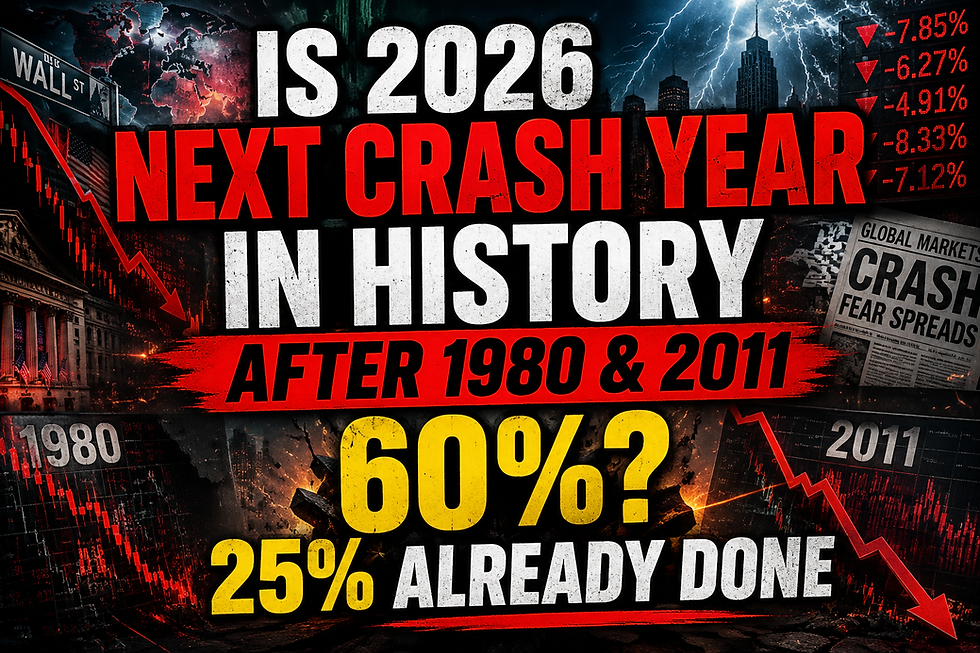
تاریخی طور پر گزشتہ 50 سالوں میں سونے نے تقریبا 50 فیصد کی دو بڑی اصلاحیں دیکھی ہیں 1980 کا انہدام اور 2011 کے بعد کی کمی۔ موجودہ اصلاح 5594 کی چوٹی سے صرف تقریبا 25 فیصد ہے۔ اگر تاریخ کوئی رہنمائی دیتی ہے اور اگر یہ سائیکل بالآخر ان دو سابقہ انہدامات جیسے کسی طرز کی پیروی کرتا ہے تو 3000 ڈالر کی طرف حرکت جو تاریخی بلندی سے تقریبا 46 فیصد کی کمی ہوگی، یہ جدید گولڈ مارکیٹ کی تاریخ میں دو بار پیش آنے والی صورتحال کے دائرے میں مکمل طور پر آتی ہے۔
گولڈالائز کے اپنے تجزیے میں یہ سوال واضح طور پر اٹھایا گیا ہے کہ آیا 2026 ایسا تیسرا انہدام کا سال بن سکتا ہے یا نہیں؟
چاندی کے 50 ڈالر تک جانے کا کیس
چاندی کا 120 ڈالر سے اوپر سے 60 کی دہائی کے وسط تک صرف چند دنوں میں گرنا اس سال دونوں دھاتوں میں سب سے شدید حرکت ہے اور مندی کا کیس اس خیال پر کھڑا ہے کہ یہ کسی بل مارکیٹ کے اندر اصلاح نہیں تھی بلکہ ایک حقیقی قیاسی مینیا کا پھٹنا تھا۔
چاندی کا انڈسٹریل ڈیمانڈ کا جزو اسے عالمی نمو کے خوف کے لیے سونے کے مقابلے میں کہیں زیادہ حساس بناتا ہے۔ اگر ایران کی جنگ ایک ہاکش فیڈ کے ساتھ مل کر عالمی مینوفیکچرنگ اور اقتصادی سرگرمی کو واقعی نقصان پہنچانا شروع کر دیتی ہے تو سولر پینلز الیکٹرانکس اور الیکٹرک گاڑیوں میں چاندی کی صنعتی طلب اسی وقت کمزور ہو سکتی ہے جب قیاسی طلب بھی منہدم ہو رہی ہو، جو ایک دوہرا دباؤ پیدا کرے گا۔
تقریبا 65 پر گولڈ سلور ریشو اپنی تاریخی رینج کے درمیان میں ہے۔ رسک اثاثوں کے لیے کسی حقیقی ڈیفلیشنری خوف کے دوران یہ ریشو ماضی میں 80 سے کہیں اوپر چلا گیا ہے، یعنی شدید دباؤ کے واقعات کے دوران چاندی سونے کے مقابلے میں ڈرامائی طور پر کمزور کارکردگی دکھا سکتی ہے۔ اگر سونا خود اوپر بیان کردہ مندی کے کیس میں 3000 سے 3500 ڈالر کے زون کی طرف جاتا ہے اور ریشو 70 یا 80 کی طرف پھیلتا ہے تو 40 سے 50 ڈالر کی رینج میں چاندی کی قیمت اس ماحول کے ساتھ ریاضیاتی طور پر ہم آہنگ ہو جاتی ہے، جو موجودہ تقریبا 64 ڈالر کی سطح سے مزید 20 سے 30 فیصد کمی کی نمائندگی کرے گی۔
تکنیکی طور پر چاندی پہلے ہی مختصر ٹائم فریمز پر اپنے سپائیک کے بعد ریزسٹنس سے مسترد ہونے کے بعد ایک ڈیسینڈنگ چینل کے اندر ہیڈ اینڈ شولڈرز پیٹرن دکھا چکی ہے۔ کئی تکنیکی پیشین گوئیاں پہلے 60 سے 63 ڈالر کے زون کو ٹیسٹ کرتے ہوئے مزید کمی کی طرف اشارہ کرتی ہیں اور اس سے نیچے بریک ہونے کی صورت میں 50 ڈالر کی سطح کی طرف راستہ کھل سکتا ہے جو ایک گول نمبر نفسیاتی سپورٹ ہوگی جو اس سال کی ریلی کے ابتدائی مراحل میں متعلقہ تھی۔
چاندی کے 150 ڈالر تک جانے کا کیس
چاندی کا اوپر جانا فقط گولڈ کا اوپر جانا اور انڈسٹری کا ساتھ دینا سلور کو اوپر لے کر جا سکتا ہے۔
کیا ہو سکتا ہے اور کیا ہونے کا امکان ہے
گولڈالائز کی جانب سے 430000 روپے فی تولہ کی سطح کو اہم لانگ ٹرم چینل سپورٹ کے طور پر شناخت کرنا آنے والے ہفتوں میں واچ کرنے کے لیے سب سے اہم مقامی تکنیکی سطح بنی رہے گی۔ ڈالر گولڈ کی مزید کمزوری کے باعث اس سطح سے نیچے کوئی ہفتہ وار کلوزنگ پاکستانی سونے کے دو سالہ بل ٹرینڈ کے لیے ایک سنگین ساختی وارننگ ہوگی۔
پاکستانی صرافہ مارکیٹ میں یہ سطحیں کس طرح ردعمل دے رہی ہیں اور فزیکل تولہ پرائسنگ میں سونے اور چاندی دونوں کے تکنیکی اشارات کے لیے تازہ ترین چارٹس اور تجزیے کے لیے گولڈالائز ملاحظہ کریں۔
دونوں ٹریڈز آنے والے ہفتوں میں دونوں سمتوں میں حقیقی رسک رکھتی ہیں اور وہ ٹریڈرز جو پاکستانی فزیکل گولڈ اور سلور مارکیٹ کے لیے سٹرکچرڈ انٹری اور ایگزٹ سطحیں چاہتے ہیں انہیں ٹریڈ سگنلز کے لیے گولڈالائز پریمیم سروسز پر غور کرنا چاہیے۔
رابطہ کریں: 03001209057
Gold spent the first quarter of 2026 in one of the most powerful rallies in its history climbing from levels near 4300 dollars to an all time record high of 5594 dollars per ounce in a matter of weeks. The catalyst was a combination of safe haven panic after the United States and Israel launched military operations against Iran on February 28 and a separate shock wave when the White House confirmed Kevin Warsh as the nominee to replace Jerome Powell as Federal Reserve Chair. Markets read the Warsh nomination as a signal that the Fed would eventually cut rates aggressively and that combined with a closed Strait of Hormuz sent gold into a vertical melt up.
Silver did something even more dramatic. It tracked gold higher through the first quarter then detached entirely and entered what can only be described as a mania. Silver tore through 70 dollars then 80 dollars then spiked above 96 dollars in a single session this month driven by physical shortage stories a widening gap between COMEX and Shanghai pricing and retail investors piling into a market that is a fraction of the size of gold. Then in 48 hours silver gave back roughly 13 percent of its value collapsing from above 96 dollars back toward 64 dollars while gold barely moved. That divergence alone tells you everything about how differently these two metals are now being priced.
In Pakistan the local market mirrored this volatility but with its own structure. Gold in Karachi hit an all time high near 585000 rupees per tola earlier this year. As of June 13 2026 the average local rate in Pakistan sits around 436000 rupees a drop of roughly 149000 rupees or about 25 percent from that record. Silver in Pakistan peaked at 18500 rupees per tola and as of the same date the average rate is quoted around 7100 to 7350 rupees representing a collapse of approximately 60 percent from its all time high. Goldalyze flagged the 430000 rupee long term channel support as the level that would decide whether the two year bull trend in Pakistani gold remains structurally intact or whether it breaks down into something much worse.
What Is Happening Right Now
As of mid June 2026 gold trades around 4219 to 4316 dollars per ounce roughly 24 to 25 percent below its record high and technically rated by multiple platforms as a strong sell on short and medium term indicators. The 200 day moving average has been broken to the downside for the first time in this entire bull cycle a major structural event that Goldalyze flagged when it happened. The immediate trigger for the latest leg down was a stronger than expected May non farm payrolls report showing 172000 jobs added against expectations near 80000 to 90000 which crushed rate cut hopes and sent the dollar higher.
Silver as of June 10 trades near 64 dollars down nearly 10 percent year to date after round tripping from below 70 to above 96 and back to the mid 60s in the space of about two weeks. The gold silver ratio currently sits near 65 meaning it takes about 65 ounces of silver to buy one ounce of gold. Historically a ratio in the 60s to 80s has marked periods where silver is considered cheap relative to gold though in a deflationary panic for silver that ratio can spike even higher before any mean reversion occurs.
The single biggest event on the calendar is the Federal Reserve meeting on June 16 and 17 which will be Kevin Warsh's first as Chair and will include a fresh dot plot and Summary of Economic Projections. Markets are pricing roughly a 97 to 98 percent probability that rates stay unchanged at 350 to 375 basis points. The real question is not the rate decision itself but the language. April's meeting saw the most divided FOMC since 1992 with four dissents and the April minutes already showed a majority leaning toward dropping the easing bias entirely. US headline CPI sits at 4.2 percent more than double the Fed's 2 percent target and PPI for May surged 1.1 percent monthly and 6.5 percent annually the highest reading since 2022. If Warsh uses this meeting to formally abandon the easing bias and shift to neutral or hawkish language it removes the last pillar that gold bulls have been leaning on.
Layered on top of all of this is the ongoing Iran war which began February 28 and has now passed the three and a half month mark with the Strait of Hormuz still effectively closed. Roughly 27 percent of the world's seaborne crude trade normally passes through that strait and traffic has collapsed from an average of 138 daily transits before the war to fewer than five per day. Brent crude spiked toward 118 to 120 dollars in late April with some analysts warning of 150 to 200 dollars if the closure persists through summer. As of early June however oil has pulled back toward the 88 to 107 dollar range after the US Energy Secretary said Hormuz traffic was rising and Trump suggested a deal was close though a full resolution remains unconfirmed.
This is the critical fundamental twist that defines this entire cycle. In a normal war gold and oil rise together because both reflect fear. In this war rising oil is increasingly read by markets as an inflation problem for the Federal Reserve rather than a safe haven signal for gold. Every time oil spikes on war headlines the market simultaneously prices in a more hawkish Fed because higher energy costs feed directly into the CPI print Warsh now has to deal with. That creates an inverted relationship where war escalation that should theoretically support gold instead caps it because it forces yields and the dollar higher. This single dynamic explains why gold has been unable to sustain rallies even as the war drags on without resolution.
The Case For 6000 Dollar Gold
The bullish case starts with the fact that gold is still up close to 30 percent year over year even after this correction which means the underlying multi year trend has not been broken only tested. A 24 to 25 percent pullback from an all time high is well within the range of normal corrections inside secular bull markets and gold has now done this twice in the current cycle without the long term channel breaking on a weekly closing basis according to Goldalyze's own channel analysis.
The geopolitical floor remains extraordinarily high. The Iran war is not resolved. The Strait of Hormuz remains under effective closure with shipping at a fraction of pre war levels and any escalation including strikes on Iranian energy infrastructure or attacks on tankers could send oil back toward 150 to 200 dollars within days. A scenario like that historically forces central banks into emergency liquidity measures even if their headline policy rate stays restrictive and that combination of inflation fear plus liquidity injection is the single most bullish environment gold can experience.
On the Fed itself there is a real possibility that Warsh disappoints the hawks. He was nominated specifically because Trump wanted lower rates and Trump has been explicit that he expects cuts. If Warsh's first meeting produces a dovish surprise relative to the hawkish positioning the market has built up the unwind in short dollar positions and the repricing of rate cut odds could send gold sharply higher in a matter of days exactly as it did in February when his nomination alone triggered a multi hundred dollar move.
Central bank buying remains a structural pillar that has not gone away. The de dollarization theme that drove gold from 2300 to over 5500 dollars in roughly eighteen months was never solely about the Iran war it reflects a multi year shift by central banks particularly in emerging markets toward holding more gold and fewer dollar reserves. That buying does not reverse on a six week correction.
Finally on pure technical structure the 4200 dollar zone now being tested coincides with the yearly open and a region multiple analysts have identified as the last line of defense before a much deeper move. If this level holds on a weekly closing basis the setup for a recovery toward 4900 and eventually a retest of the 5594 all time high and beyond toward 6000 dollars becomes the dominant scenario particularly if oil spikes again on war escalation and the Fed is forced into a dovish pivot regardless of its stated intentions.
The Case For 3000 Dollar Gold
The bearish case is built on hard technical damage that has already occurred. Gold has broken its 200 day moving average to the downside for the first time in this cycle. It has lost the psychologically important 4500 dollar zone and multiple platforms now rate the pair a strong sell on daily and weekly timeframes. The break below 4319 dollars on a closing basis according to several technical desks would open the door to the next major leg of the decline with little support until much lower levels.
The macro backdrop for gold has fundamentally changed. Gold's 2024 to early 2026 rally was built on the expectation of Fed rate cuts a weakening dollar and falling real yields. Every one of those pillars is now reversing. The Fed funds rate has been steady at 350 to 375 basis points for three consecutive meetings. The 10 year Treasury yield sits near 4.5 percent and the 2 year near 4.1 to 4.2 percent both near multi month highs. CPI at 4.2 percent and the hottest PPI print since 2022 give Warsh every justification to formally shift to a neutral or hawkish bias at this week's meeting. Some banks have already cut their gold forecasts by 300 to 900 dollars citing what they call a double whammy of a stronger dollar and firmer economic data.
The inverted oil gold relationship described earlier becomes the engine of the bear case if it persists. As long as the market treats rising oil as a reason for the Fed to stay restrictive rather than as a safe haven trigger every geopolitical escalation that would have once been bullish for gold instead becomes another reason for yields and the dollar to rise which mechanically pressures gold lower. If the Iran war drags on for months in this stalemate state where oil stays elevated but does not spike to truly catastrophic levels gold could simply keep grinding lower as real yields stay elevated.
Historically gold has experienced two major corrections of roughly 50 percent in the past 50 years, the 1980 collapse and the post 2011 decline. The current correction from the 5594 peak is only around 25 percent. If history is any guide and if this cycle ultimately follows a similar pattern to those two prior collapses a move toward 3000 dollars which would represent close to a 46 percent drawdown from the all time high is well within the range of what has happened twice before in modern gold market history. Goldalyze's own analysis has explicitly flagged this question asking whether 2026 becomes the third such crash year.
Finally a resolution of the Iran war itself paradoxically could be bearish for gold in the near term. If a ceasefire or negotiated settlement removes the geopolitical premium entirely oil could fall sharply removing the inflation argument for the Fed to stay hawkish but it would also strip out the safe haven bid that has been propping gold up during every dip. A peace deal headline could trigger an immediate sharp selloff in gold even if it is ultimately good news for the global economy.
The Case For 50 Dollar Silver
Silver's collapse from above 96 dollars to the mid 60s in 48 hours is the single most violent move across either metal this year and the bear case rests on the idea that this was not a correction inside a bull market but the bursting of a genuine speculative mania. The run up to 96 dollars was driven by retail mania narratives a COMEX versus Shanghai arbitrage story and parabolic price action all classic hallmarks of a blow off top rather than sustainable demand growth.
Silver's industrial demand component makes it far more sensitive to global growth fears than gold. If the Iran war combined with a hawkish Fed begins to genuinely damage global manufacturing and economic activity industrial demand for silver in solar panels electronics and electric vehicles could soften at exactly the moment speculative demand is also collapsing creating a double headwind.
The gold silver ratio near 65 is roughly in the middle of its historical range. In a genuine deflationary scare for risk assets that ratio has spiked well above 80 in the past meaning silver can underperform gold dramatically during stress events. If gold itself heads toward the 3000 to 3500 dollar zone described in the bear case above and the ratio expands toward 70 or 80 a silver price in the 40 to 50 dollar range becomes mathematically consistent with that environment representing a further 20 to 30 percent decline from current levels around 64 dollars.
Technically silver has already demonstrated a head and shoulders pattern inside a descending channel on shorter timeframes following its rejection from resistance after the spike. Several technical forecasts point toward continued downside testing the 60 to 63 dollar zone first with a break below that opening the path toward the 50 dollar level which would represent a round number psychological support last relevant during the earlier stages of this year's rally.
The Case For 150 Dollar Silver
The bullish case for silver starts with the fact that even after this brutal 48 hour collapse silver is still trading near 64 dollars which is dramatically higher than where it started 2026. The structural story that drove silver from the 30s into the 90s did not disappear in two days. The COMEX versus Shanghai pricing gap that multiple reports flagged as a sign of genuine physical tightness in the silver market is a supply side issue that does not resolve simply because speculative froth got flushed out.
If the broader macro environment shifts toward stagflation which is increasingly the scenario being discussed given 4.2 percent CPI alongside war driven oil price uncertainty silver historically outperforms gold on the way up because it carries both a monetary hedge characteristic and an industrial scarcity premium simultaneously. A stagflationary 1970s style environment which several analysts have explicitly compared this period to was precisely the environment in which silver delivered some of its largest percentage gains in history.
The mania that took silver to 96 dollars proved that the market is capable of repricing this metal violently and quickly in both directions. If the underlying catalysts that drove that spike namely physical shortage and a widening east west pricing gap remain unresolved or worsen there is no technical reason silver could not revisit and exceed 96 dollars on the next wave particularly if it is accompanied by a genuine breakdown in the dollar following a dovish Fed surprise from Warsh.
A move toward 150 dollars would require an extraordinary combination of factors a major Fed dovish pivot a severe escalation in the Iran war that genuinely threatens global oil supply at scale and a continuation of the physical silver shortage narrative all arriving together. While this is a low probability outcome in any given month the asymmetry argument from silver bulls is that the metal has already shown it can move 13 percent in 48 hours so a 150 dollar print within a twelve to eighteen month window during a genuine crisis scenario is not the outlandish call it would sound like in normal market conditions.
What Could Happen And What Will Likely Happen
The most important date on the calendar is June 17 when Warsh delivers his first policy statement alongside an updated dot plot. The base case priced by markets is a hold on rates with language that drops the explicit easing bias in favor of a neutral stance. If that base case plays out exactly as expected the most likely outcome is continued consolidation for gold in the 4150 to 4500 dollar range as the market digests confirmation that rate cuts are off the table for now without an outright hawkish shock that would force a sharper break lower.
The scenario that resolves this entire debate is the Iran war. A genuine ceasefire or peace deal removes the geopolitical premium from both oil and gold simultaneously and in the near term that is more likely to be bearish for gold than bullish because it removes the safe haven bid faster than it removes inflation fear given how embedded current CPI readings already are. Conversely a major escalation such as a successful strike on a key Iranian export terminal or a sustained closure that finally produces the 150 to 200 dollar oil scenario analysts warned about in March would likely overwhelm the inverted correlation entirely and drive both gold and silver sharply higher as the situation crosses from an inflation story into a genuine global crisis story.
For Pakistan specifically the local market will continue to track international XAU and XAG prices converted through the USD PKR exchange rate which means any rupee depreciation against the dollar driven by Pakistan's own external account pressures can partially offset or amplify moves in the dollar gold price when converted to rupees per tola. Goldalyze's identification of the 430000 rupee per tola level as the critical long term channel support remains the single most important local technical level to watch in the coming weeks. A weekly close below that level on the back of further dollar gold weakness would be a serious structural warning sign for the two year Pakistani gold bull trend.
Why Focused
The reason this moment deserves intense focus rather than passive observation is that gold and silver have just delivered the sharpest two way volatility of the entire 2026 cycle within a span of roughly two weeks. Gold broke a multi year moving average for the first time. Silver round tripped a 13 percent move in 48 hours. And all of this happened in the days immediately preceding the first Fed meeting under an entirely new Chair whose communication style is still unknown to the market.
This combination of a structural technical break a historic speculative unwind and a regime change at the Federal Reserve happening within the same fourteen day window is the kind of setup that historically precedes the next major directional move whichever way it goes. Positioning before clarity emerges from the June 17 statement carries elevated risk in both directions which is exactly why disciplined entries exits and risk management matter more now than at almost any other point this year.
For real time updates on how these levels are reacting in the Pakistani Sarafa market and for technical signals on both gold and silver in physical tola pricing visit Goldalyze for the latest charts and analysis.
Both of these trades carry real risk in either direction over the coming weeks and traders who want structured entry and exit levels for the physical Pakistani gold and silver market should consider Goldalyze premium services for trade signals.